进程管理
概览
就像windows我们通过任务管理器来查看运行在前台和运行在后台不同的服务、程序一样,在Linux上有一系列命令是用来管理进程的
ps
简单帮助
ps --help
ps --help all
man ps

ps - report a snapshot of the current processes.
ps [options]

ps 给出的是系统当前运行进程的一个快照,要想实时看到系统中进程的变化,可以用 top 命令

ps的参数比较多,并且有时需要区分格式,具体情况可通过实际测试观察到

This version of ps accepts several kinds of options:
1   UNIX options, which may be grouped and must be preceded by a dash.
2   BSD options, which may be grouped and must not be used with a dash.
3   GNU long options, which are preceded by two dashes.

使用示例
[root@xingyongsheng ~]# ps aux | head -5
USER       PID %CPU %MEM    VSZ   RSS TTY      STAT START   TIME COMMAND
root         1  0.0  0.0 191132  3692 ?        Ss   Feb14   0:45 /usr/lib/systemd/systemd --system --deserialize 20
root         2  0.0  0.0      0     0 ?        S    Feb14   0:00 [kthreadd]
root         3  0.0  0.0      0     0 ?        S    Feb14  29:32 [ksoftirqd/0]
root         5  0.0  0.0      0     0 ?        S<   Feb14   0:00 [kworker/0:0H]

ps -ef: 用户进程不带中括号, 内核进程带中括号
用户进程祖先(1号进程, systemd); 内核进程祖先(2号进程, kthreadd)
tty ? 一般表示后台服务
常见操作组合
[root@xingyongsheng ~]# ps  | head -3
  PID TTY          TIME CMD
 9623 pts/1    00:00:00 bash
32505 pts/1    00:00:00 bash
PID  进程号,比如用 "kill 进程号" ,结束该进程
TTY  进程所属的终端控制台
TIME 进程所使用的CPU时间
CMD  正在执行的命令


[root@xingyongsheng ~]# ps -ef | head -3
UID        PID  PPID  C STIME TTY          TIME CMD
root         1     0  0 Feb14 ?        00:00:45 /usr/lib/systemd/systemd --system --deserialize 20
root         2     0  0 Feb14 ?        00:00:00 [kthreadd]
UID    执行该进程的用户
PID    进程号
PPID   进程的父进程号
C      CPU使用的资源百分比
STIME  进程开始时间
TTY    进程在哪个终端窗口里执行,若与终端无关,则显示 "?" ,tty1-tty6 ,是本机上面的登陆者,pts/0 pts/1 ... 这样的属于网络连接的进程(多开几个终端窗口用w命令可看到)
TIME   进程所使用的总CPU时间
CMD    正在执行的命令


[root@xingyongsheng ~]# ps aux | head -5
USER       PID %CPU %MEM    VSZ   RSS TTY      STAT START   TIME COMMAND
root         1  0.0  0.0 191132  3692 ?        Ss   Feb14   0:46 /usr/lib/systemd/systemd --system --deserialize 20
root         2  0.0  0.0      0     0 ?        S    Feb14   0:00 [kthreadd]
root         3  0.0  0.0      0     0 ?        S    Feb14  29:32 [ksoftirqd/0]
root         5  0.0  0.0      0     0 ?        S<   Feb14   0:00 [kworker/0:0H]
USER   哪个用户执行的这个进程
PID    进程号
%CPU   进程使用掉的CPU资源百分比
%MEM   进程所占用的物理内存百分比
VSZ    该进程使用掉的虚拟内存,单位KB
RSS    该进程使用的固定内存,单位KB
TTY    同上
STAT   该进程目前的状态
    PROCESS STATE CODES
       Here are the different values that the s, stat and state output specifiers (header "STAT" or "S") will display to describe the state of a process:

               D    uninterruptible sleep (usually IO)
               R    running or runnable (on run queue)
               S    interruptible sleep (waiting for an event to complete)
               T    stopped by job control signal
               t    stopped by debugger during the tracing
               W    paging (not valid since the 2.6.xx kernel)
               X    dead (should never be seen)
               Z    defunct ("zombie") process, terminated but not reaped by its parent

       For BSD formats and when the stat keyword is used, additional characters may be displayed:

               <    high-priority (not nice to other users)
               N    low-priority (nice to other users)
               L    has pages locked into memory (for real-time and custom IO)
               s    is a session leader
               l    is multi-threaded (using CLONE_THREAD, like NPTL pthreads do)
               +    is in the foreground process group
START    该进程被触发启动的时间
TIME     该进程实际使用的CPU时间
COMMAND  该进程的实际命令
实际场景举例
查找某个进程是否运行 ?
ps -ef | grep ssh   OR
ps aux | grep ssh

查看系统里一共有多少进程 ?
ps -ef | wc -l   OR
ps aux | wc -l

查看系统里一共有多少线程 ?
ps xH | wc -l           OR
ps -e -f H | wc -l      OR

找出系统中使用内存最大的进程
ps aux | sort -rnk4 | head

找出系统中使用CPU最大的进程
ps aux | sort -rnk3 | head

统计某个相关进程CPU使用累加和
ps aux  | fgrep "php-fpm: pool api.sxxx.com.cn" | awk '{ sum += $3 }; END { print sum }'
树形显示进程
root@localhost:/tmp # ps -ef f  | egrep "nginx|PID"
UID        PID  PPID  C STIME TTY      STAT   TIME CMD
root     22664     1  0 Feb11 ?        Ss     1:37 nginx: master process /usr/local/bin/tengine -c /usr/local/etc/tengine.conf
www      10516 22664  0 Jun28 ?        S     84:25  \_ nginx: worker process
www      10520 22664  0 Jun28 ?        S     84:40  \_ nginx: worker process
www      10526 22664  0 Jun28 ?        S     84:00  \_ nginx: worker process
www      10528 22664  0 Jun28 ?        S     84:14  \_ nginx: worker process
www      10531 22664  0 Jun28 ?        S     84:17  \_ nginx: worker process
www      10535 22664  0 Jun28 ?        S     84:37  \_ nginx: worker process
www      10539 22664  0 Jun28 ?        S     84:44  \_ nginx: worker process
www      10543 22664  0 Jun28 ?        S     84:15  \_ nginx: worker process
www      10547 22664  0 Jun28 ?        S     84:28  \_ nginx: worker process
www      10551 22664  0 Jun28 ?        S     84:53  \_ nginx: worker process
www      10552 22664  0 Jun28 ?        S     84:19  \_ nginx: worker process
www      10554 22664  0 Jun28 ?        S     83:46  \_ nginx: worker process
www      10556 22664  0 Jun28 ?        S     84:19  \_ nginx: worker process
www      10557 22664  0 Jun28 ?        S     84:35  \_ nginx: worker process
www      10560 22664  0 Jun28 ?        S     85:30  \_ nginx: worker process
www      10564 22664  0 Jun28 ?        S     85:19  \_ nginx: worker process
www      10570 22664  0 Jun28 ?        S     84:51  \_ nginx: worker process
www      10575 22664  0 Jun28 ?        S     84:24  \_ nginx: worker process
www      10580 22664  0 Jun28 ?        S     84:50  \_ nginx: worker process
www      10581 22664  0 Jun28 ?        S     85:15  \_ nginx: worker process
www      10582 22664  0 Jun28 ?        S     84:47  \_ nginx: worker process
www      10583 22664  0 Jun28 ?        S     85:58  \_ nginx: worker process
www      10584 22664  0 Jun28 ?        S     84:49  \_ nginx: worker process
www      10585 22664  0 Jun28 ?        S     84:28  \_ nginx: worker process
www      10586 22664  0 Jun28 ?        S      0:40  \_ nginx: cache manager process
root     21154 19359  0 16:42 pts/0    S+     0:00  |       \_ grep -E --color=auto nginx|PID
csdn id 109997714
pstree
pstree可以树状形式显示进程之间的关系,非常直观

Usage: pstree [ -a ] [ -c ] [ -h | -H PID ] [ -l ] [ -n ] [ -p ] [ -g ] [ -u ]
              [ -A | -G | -U ] [ PID | USER ]

pstree --help
man pstree
info pstree

[root@xingyongsheng ~]# pstree
systemd─┬─AliYunDun───23*[{AliYunDun}]
        ├─AliYunDunUpdate───3*[{AliYunDunUpdate}]
        ├─2*[agetty]
        ├─aliyun-service───2*[{aliyun-service}]
        ├─atd
        ├─auditd───{auditd}
        ├─chronyd
        ├─crond
        ├─dbus-daemon
        ├─dhclient
        ├─dockerd─┬─docker-containe─┬─docker-containe─┬─3*[bash]
        │         │                 │                 ├─java───18*[{java}]
        │         │                 │                 ├─tail
        │         │                 │                 └─9*[{docker-containe}]
        │         │                 ├─docker-containe─┬─bash
.......


显示全部线程数
pstree -alp | wc -l

查看线程命令
    ps -eLf | wc -l
    pstree -p
    pstree -al
pgrep
pgrep --help
查找匹配条件的进程

ps -ef | grep docker
pgrep docker     <===>    ps -ef | grep docker | grep -v grep | awk '{print $2}' > /tmp/1.txt
pkill
待更新
kill
kill - terminate a process
kill [-s signal|-p] [-q sigval] [-a] [--] pid...
kill -l [signal]

kill接上进程ID,用来平滑关闭某个进程,相当于系统通知某个进程,你该关闭了,然后该进程正常关闭,如果正常kill无法关闭,则可能需要使用kill -9 pid,表示强杀

[root@xingyongsheng ~]# kill -l
 1) SIGHUP	 2) SIGINT	 3) SIGQUIT	 4) SIGILL	 5) SIGTRAP
 6) SIGABRT	 7) SIGBUS	 8) SIGFPE	 9) SIGKILL	10) SIGUSR1
11) SIGSEGV	12) SIGUSR2	13) SIGPIPE	14) SIGALRM	15) SIGTERM
....


ps aux | grep mysql
kill 5417  <==>  kill -15  5417  <===> kill  -s SIGTERM 5417   <===>  kill -s 15 5417
kill -9 5417

根据要kill的具体进程不同,有时候用kill一个进程可能比较慢,尤其是不加-9参数的时候,比如kill一些比较重量的java进程的时候,此时我们可以等待几十秒,或者反复调用kill pid

[root@xingyongsheng ~]# ps aux | grep mysql
root      5417  0.0  0.0 112712   960 pts/0    R+   23:00   0:00 grep --color=auto mysql
polkitd  28138  0.2  3.0 4737408 498924 ?      Ssl  Feb17 107:22 mysqld
polkitd  28288  0.0  0.0      0     0 ?        Z    Feb17   0:00 [mysqld_safe] <defunct>

如果我们要kill的东西很多,比如运行了多个docker容器,可以下面这样
for i in `pgrep docker`; do echo "kill $i"; done;
for i in `pgrep docker`; do echo "kill $i" >> /tmp/tmp.sh; done;   把要执行的命令先放到脚本里
pgrep -a docker  和上面的内容对比,确认之后再执行脚本实际的kill
pgrep docker | xargs -n 1 kill

有时候我们需要非常精确的找到一个进程,以确保kill的时候不会出错,此时不妨执行这个进程的时候使用命令的绝对路径,并使用类似 ps aux | fgrep "keyword" 来确保搜索到的结果唯一
csdn 110203680
killall
待更新
top - display Linux processes
top命令可以实时的显示系统中进程,使用资源情况,如进程占用的内存,CPU百分比等
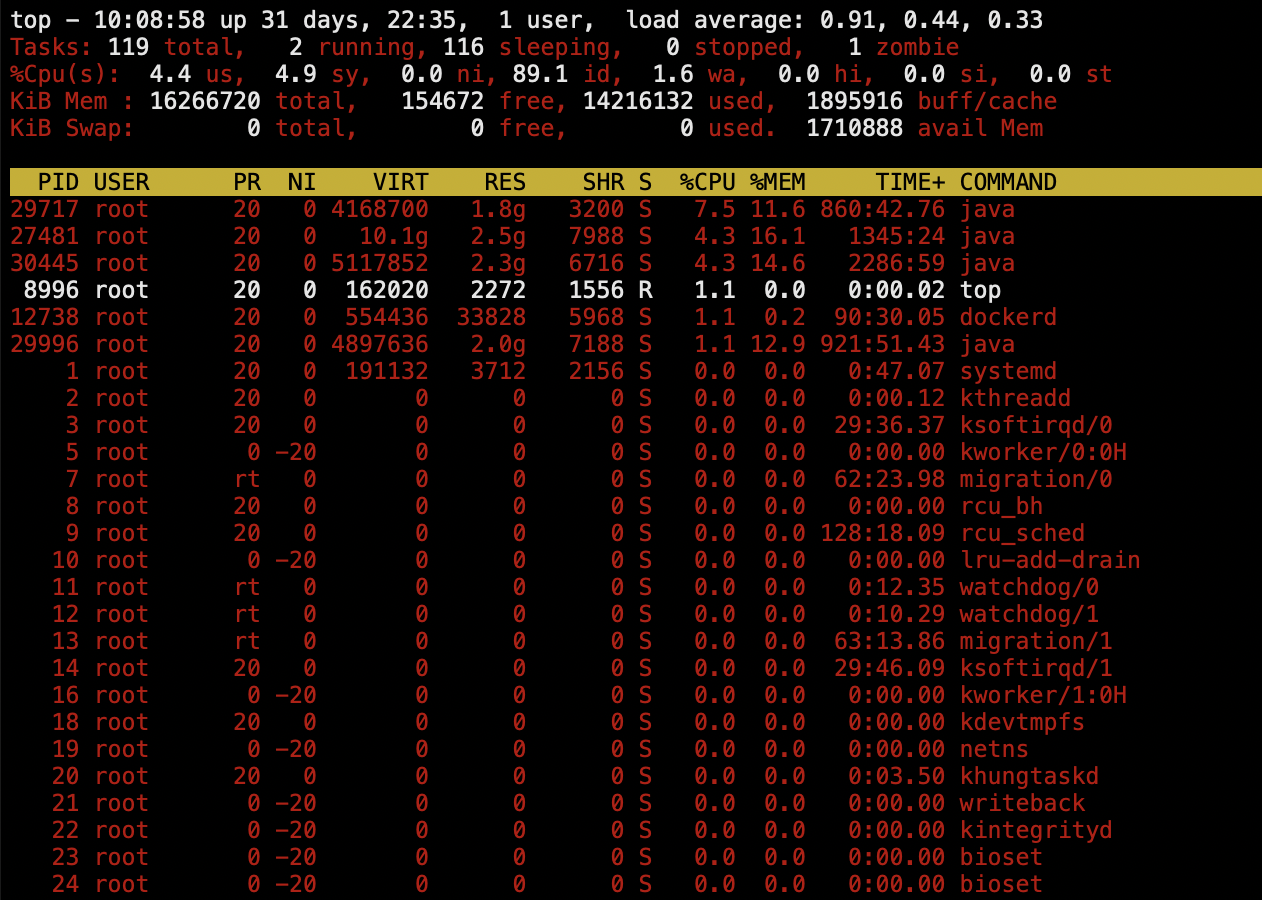
第1行信息,同 uptime 命令第执行结果,分别是
当前系统时间   系统一共运行时间   当前系统有几个用户在登陆  负载情况(1m,5m,15m)
第2行信息  进程总体状态
系统的进程总数   运行状态的进程数   休眠状态  停止状态  僵死状态
第3行 CPU状态
us用户空间占用CPU百分比   sy内核空间占用的CPU百分比  ni改变过优先级的进程占用的CPU百分比   id空闲CPU百分比   wa(I/O等待占用的CPU百分比)   hi硬终端占用的CPU百分比  si软中断占用的CPU百分比  st虚拟机占用的CPU百分比
第4行 内存状态
物理内存总量total    空闲内存总量free    使用中的内存总量used     缓冲的内存量buff/cache
第5行   swap交换分区信息
同上
第6行  空行
第7行  各进程的任务状态
    PIP      进程id
    USER     进程所有者
    PR       进程优先级
    NI       nice值,负值表示高优先级,正值表示低优先级
    VIRT     进程使用的虚拟内存总量,单位kb
    RES      进程使用的未被换出的物理内存大小,单位kb
    SHR      共享内存大小,单位kb
    S        进程状态,参考上文PS的帮助
    %CPU     CPU时间占用百分比
    %MEM     物理内存使用百分比
    TIME+    进程使用的CPU时间总计,单位1/100秒
    COMMAND  进程名称或执行的命令
切换显示多核不同CPU信息,按下键盘上的 1

切换内存的显示方式, m
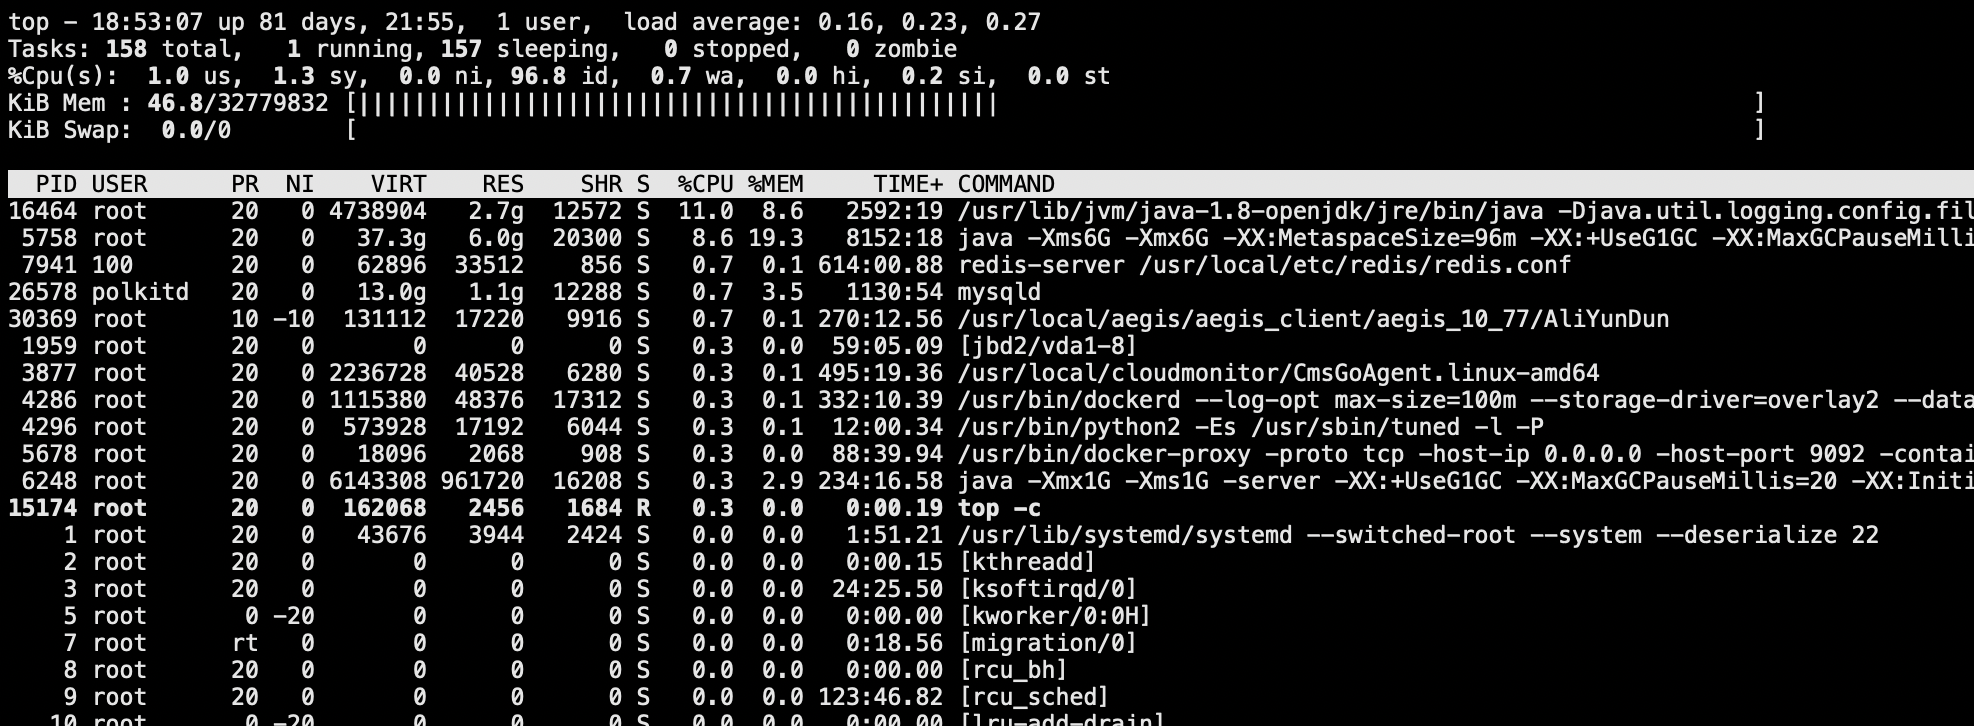
c 切换显示命令名称和完整命令行 M 根据驻留内存大小进行排序
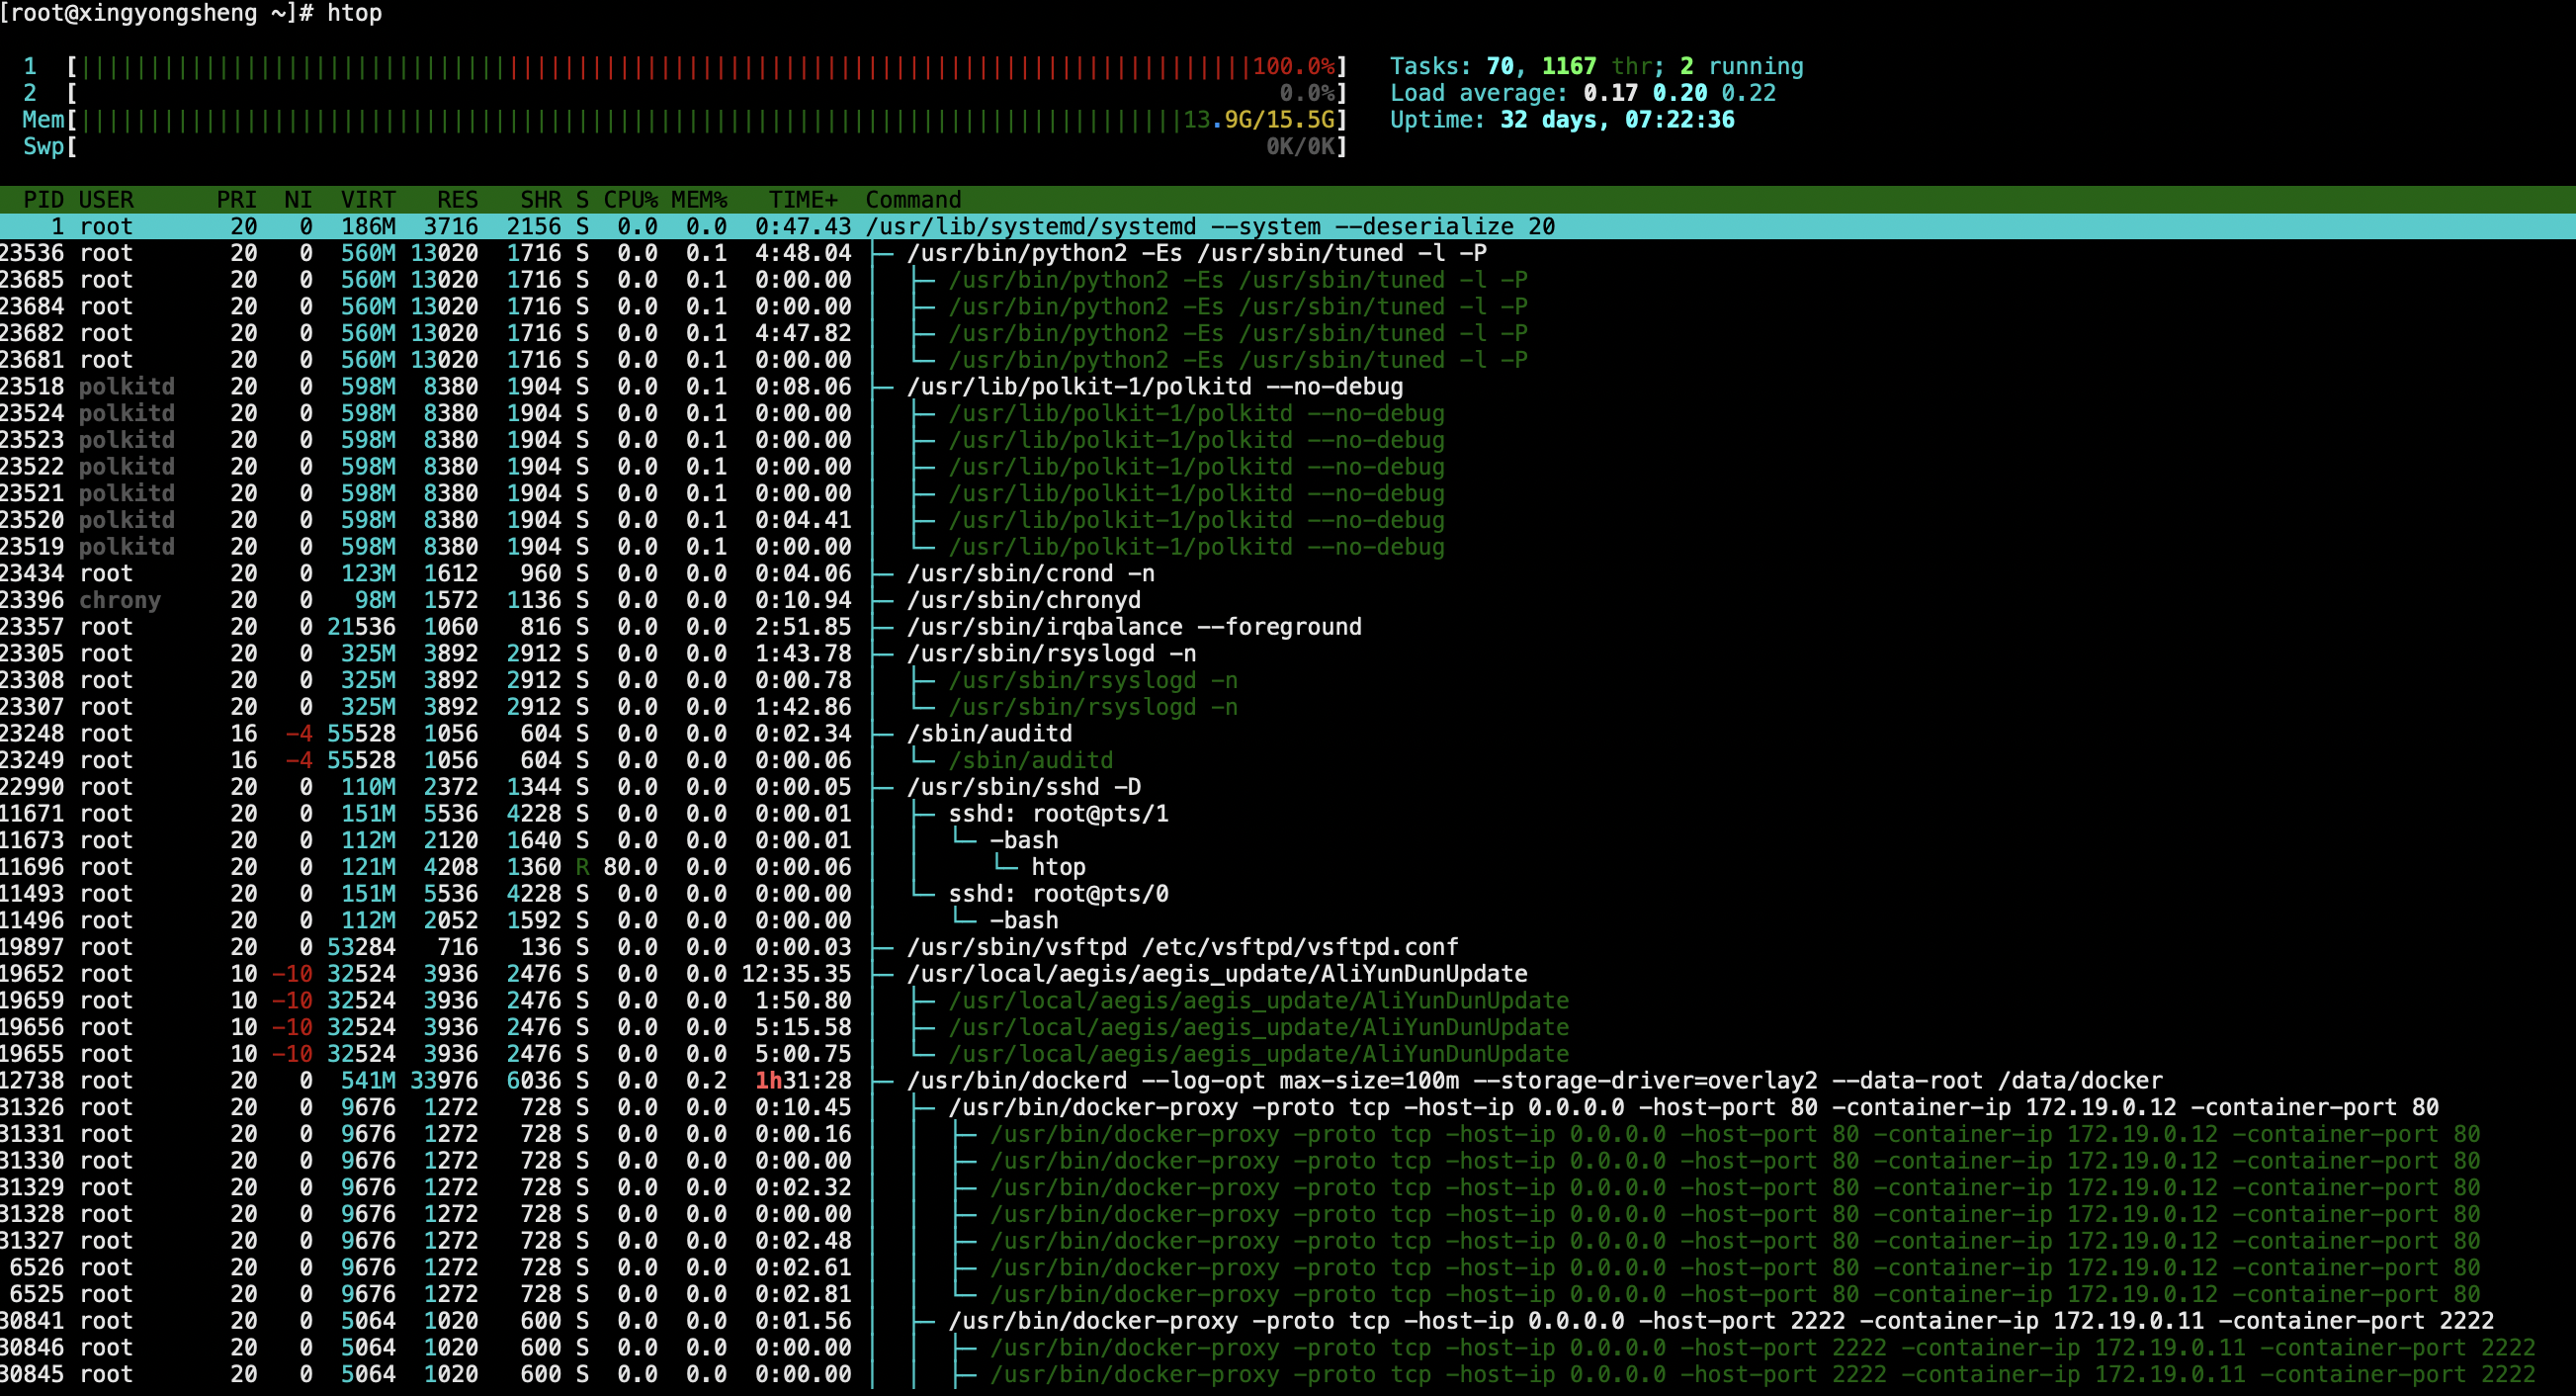
htop
yum install htop
htop --help
nice
nice - run a program with modified scheduling priority
nice [OPTION] [COMMAND [ARG]...]
Run  COMMAND with an adjusted niceness, which affects process scheduling.  With no COMMAND, print the current niceness.  Niceness values range from -20 (most favorable to the process) to 19(least favorable to the process).
renice
renice - alter priority of running processes
renice [-n] priority [-gpu] identifier...
nohup 与 &
很多时候,我们需要程序在后台运行,Linux与其它带有图形界面的操作系统不同,比如在windows里我们可以有多个窗口,当前不想用这个窗口的时候把该窗口最小化什么的就好了,而在Linux下我们一般只开一个窗口,如果想让程序在后台运行,需要借助一些命令来辅助,如下面这样
ping baidu.com > /tmp/ping-baidu.log &
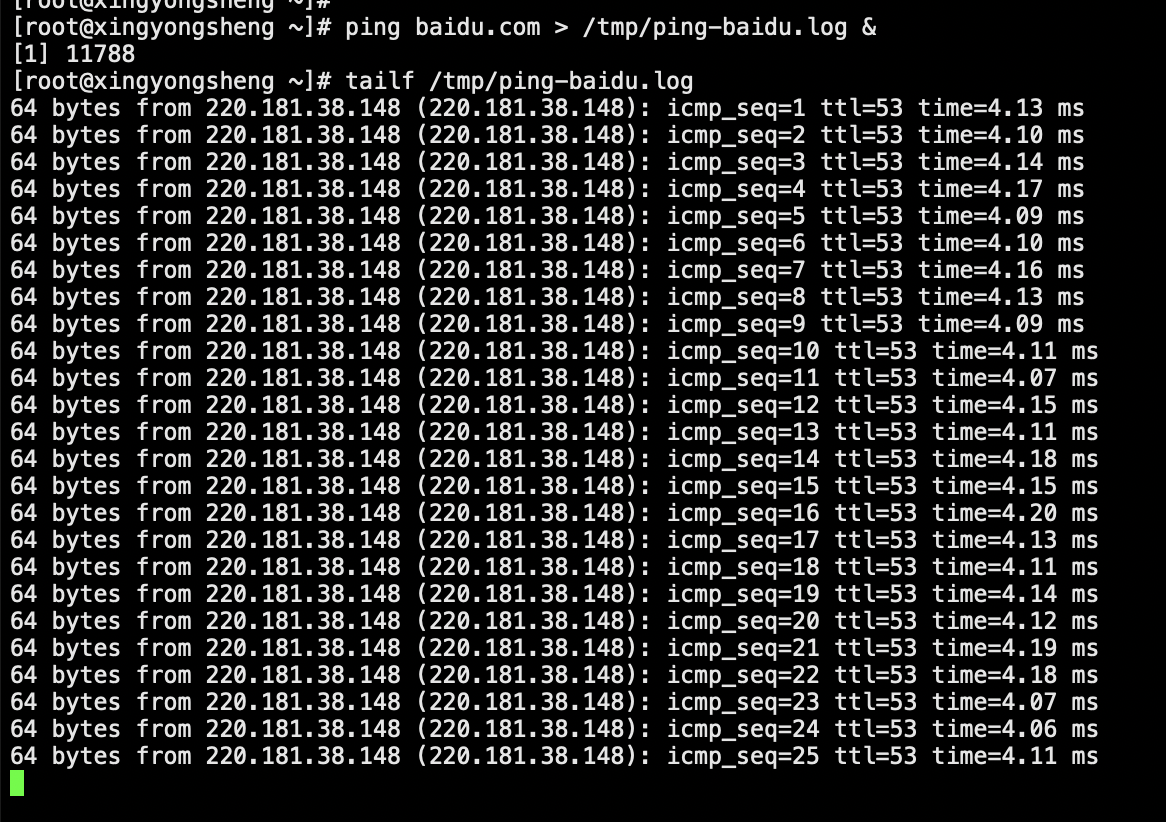
这样我们过半小时,查看下对应文件里的内容,就可以大致知道自己的网卡不卡,但是上面的命令有一点不好的是,如果我们把执行这个命令的窗口关掉,这个程序就自动退出去了,如果我们希望即使窗口关掉程序仍在后台继续执行,就需要配合nohup命令使用
nohup ping baidu.com > /tmp/ping-baidu.log &
结束系统中多个相同的进程
ps -ef | grep ping | grep -v grep | awk '{print $2}' | xargs -n 1 kill
把正确和错误的内容都定向到同一个文件可以使用 &>
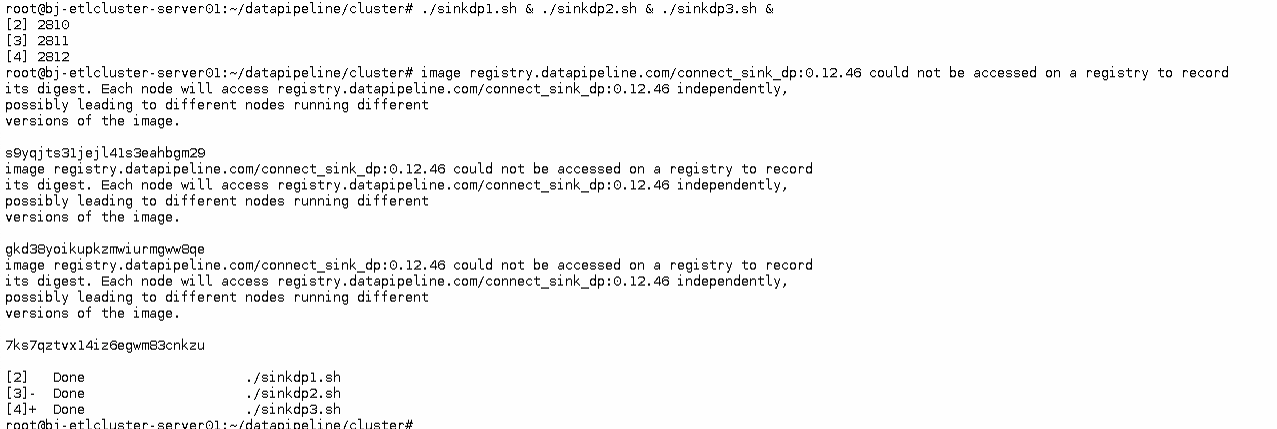
并发 && ||
./1.sh && ./2.sh
./1.sh & ./2.sh & ./3.sh
./1.sh || ./2.sh
strace
strace是Linux环境下的一款程序调试工具,用于检查一个应用程序所使用的系统调用以及它所接收的系统信息。strace会追踪程序运行时的整个生命周期,输出每一个系统调用的名字、参数、返回值和执行所消耗的时间等,是高级运维和开发人员排查问题的杀手锏。
https://www.cnblogs.com/machangwei-8/p/10388883.html
ltrace
ltrace能够跟踪进程的库函数调用,它会显现出调用了哪个库函数,而strace则是跟踪进程的每个系统调用。
runlevel
[root@xingyongsheng ~]# runlevel
N 3

0 停机
1 单用户模式
2 无网络 多用户模式
3 多用户模式
4 未使用
5 图形界面 多用户模式
6 重启
init
初始化Linux进程

[root@xingyongsheng ~]# init --help
init [OPTIONS...] {COMMAND}

Send control commands to the init daemon.

     --help      Show this help
     --no-wall   Don't send wall message before halt/power-off/reboot

Commands:
  0              Power-off the machine
  6              Reboot the machine
  2, 3, 4, 5     Start runlevelX.target unit
  1, s, S        Enter rescue mode
  q, Q           Reload init daemon configuration
  u, U           Reexecute init daemon
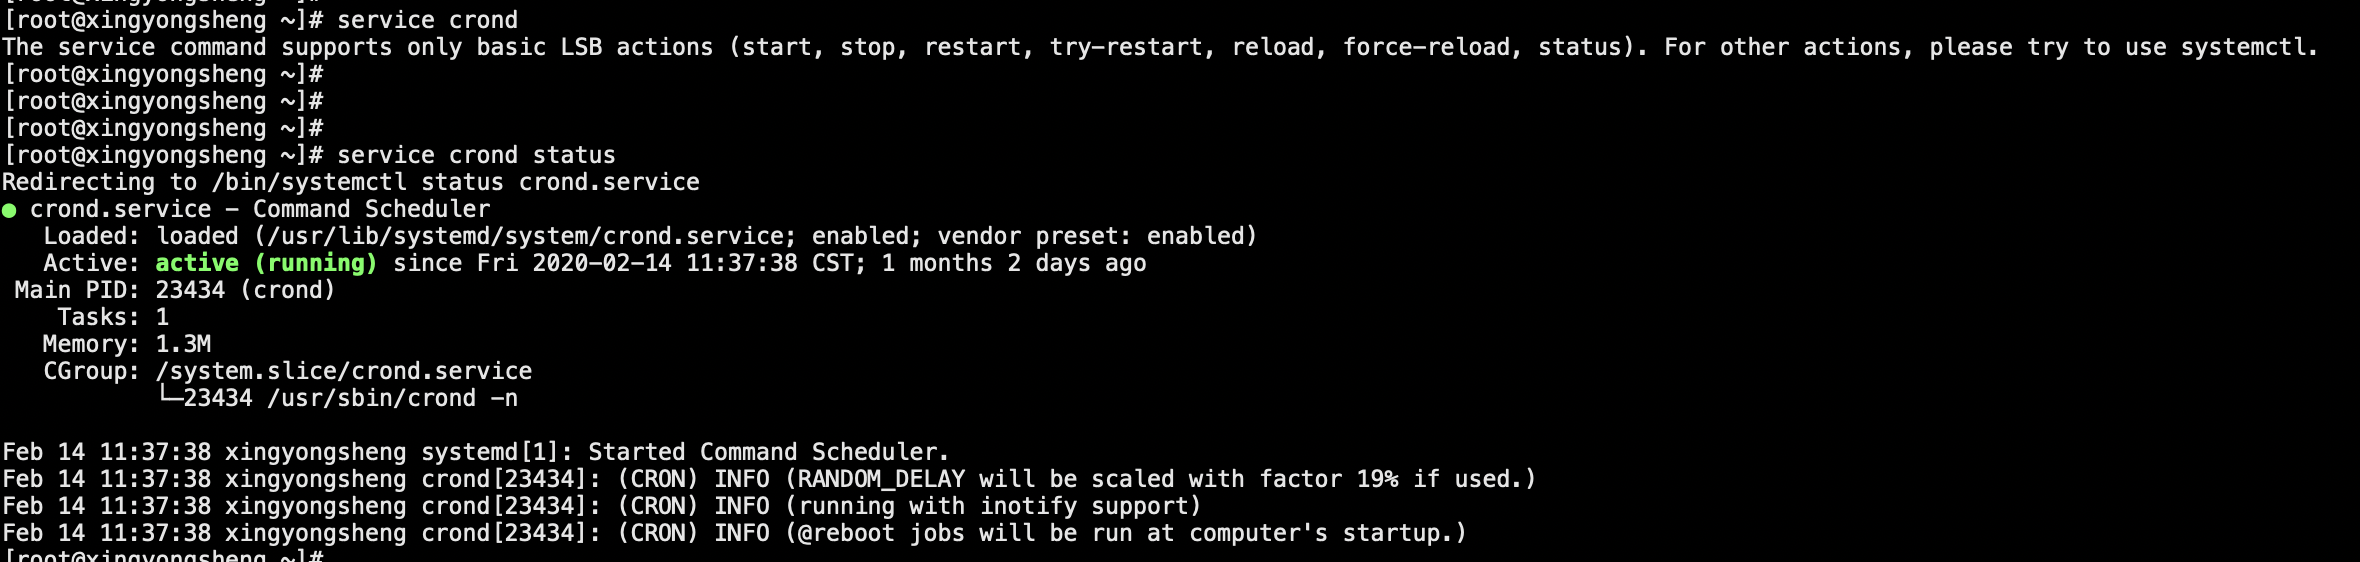
service
管理系统服务

NAME
    service - run a System V init script

SYNOPSIS
    service SCRIPT COMMAND [OPTIONS]
    service --status-all
    service --help | -h | --version
lsof - 查看进程打开的文件
[root@dp27m1 ~]# rpm -qf $(which lsof)
lsof-4.87-6.el7.x86_64

lsof -h
man lsof

查看系统一共打开了多少文件
lsof | wc -l
lsof > /tmp/tmp.txt

查看某个文件正在由哪个进程使用
lsof /var/log/messages  OR lsof | grep 'system.log'

查看某个进程打开了的文件
lsof -c rsyslog

查看某个进程号打开的文件
lsof -p 1277

查看所有进程
lsof -i
查看所有tcp网络连接的进程
lsof -i tcp
查看显示端口为22的进程
lsof -i :22
显示同时满足tcp和端口为22的进程
lsof -i tcp:22
取消域名解析,取消端口转换成服务名
lsof -n -P  -i :22

显示指定用户打开的文件
lsof -u root

显示所有socket文件
lsof -U